The digital marketplace is no longer just an alternative to brick-and-mortar stores; it’s the primary way a growing number of consumers discover, compare, and purchase products. As we move through 2025, the eCommerce landscape is evolving at a breakneck pace, driven by new technologies, shifting consumer behaviors, and expanding global access. For any business to thrive, staying on top of the latest eCommerce statistics isn’t just beneficial—it’s essential for survival and growth. This article breaks down the most critical data points and trends that will define online retail this year.
Key Takeaways
- Massive Growth Continues: Global eCommerce sales are projected to soar past $6.5 trillion in 2025, showcasing the sector’s relentless expansion.
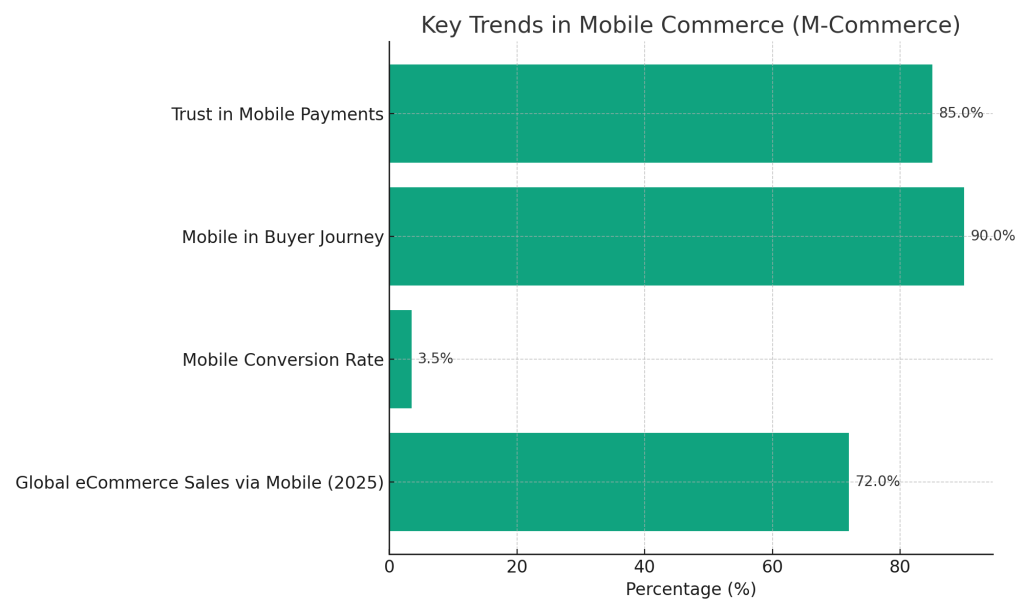
- Mobile is Dominant: Mobile commerce is set to account for about 59% of all online retail sales worldwide in 2025, making a mobile-first strategy non-negotiable.
- Customer Experience is King: Shoppers have high expectations, from fast, free shipping to seamless checkout experiences. The average cart abandonment rate hovers around 70%, often due to unexpected costs and complicated processes.
- AI and Personalization Drive Sales: Artificial intelligence is no longer a futuristic concept but a present-day tool that can boost sales by 15-30% through personalized recommendations and streamlined customer service.
Global eCommerce Growth Statistics
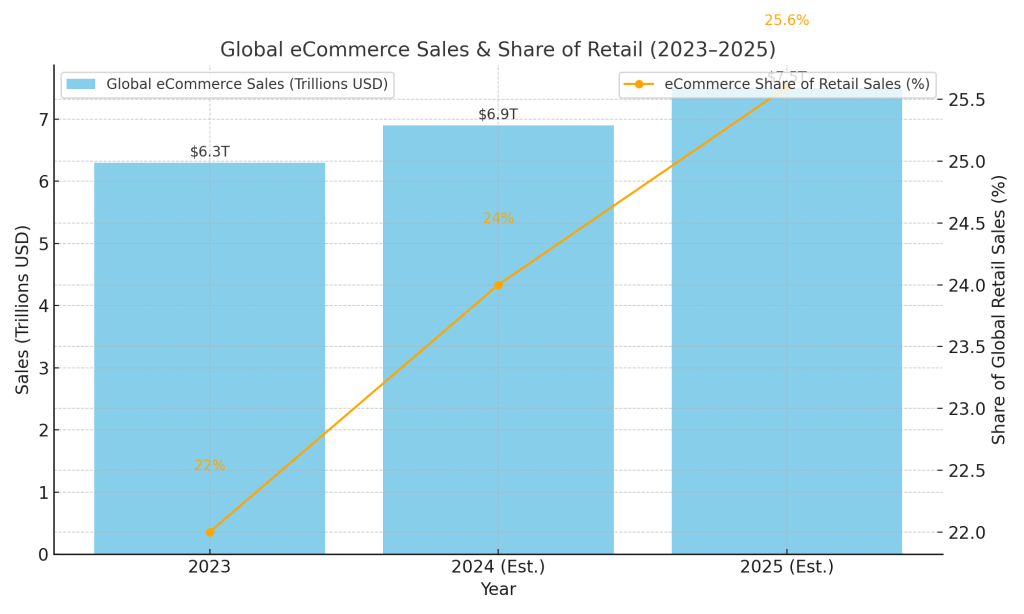
The global eCommerce market continues its remarkable upward trajectory. In 2025, worldwide eCommerce sales are expected to reach an estimated $6.56 trillion. This incredible figure underscores the seismic shift in consumer spending habits.
- eCommerce’s Share of Retail: Online sales are projected to account for 21% of all retail purchases in 2025.
- Leading Markets: China continues to dominate the eCommerce landscape, generating over $1.47 trillion in revenue. The USA and the UK follow as other major players in global eCommerce revenue.
- Emerging Markets: Keep an eye on Turkey, Brazil, and India, which are showing some of the fastest compound annual growth rates (CAGR) in the world.
Mobile Commerce (M-Commerce) Statistics
The world shops on its phone. Mobile commerce has officially overtaken desktop as the primary channel for online shopping.
- M-Commerce Dominance: In 2025, an estimated 59% of all eCommerce sales are expected to happen via a mobile device. This amounts to over $4 trillion in sales.
- Mobile Shopping Behavior: In the U.S., 76% of adults make purchases using their smartphones. Consumers use their phones for every stage of the buying journey, from discovering new products on social media to making the final purchase.
- Mobile Wallets: The convenience of mobile payment methods like Apple Pay and Google Pay is a significant driver of m-commerce growth, with digital wallets accounting for a huge portion of online transactions.
Consumer Behavior & Shopping Preferences

Understanding the modern shopper is key to unlocking eCommerce success. Today’s consumers are informed, demanding, and digitally savvy.
- The Rise of the Researcher: Over 80% of users now conduct online research before making a purchase. This makes a strong online presence, detailed product pages, and positive reviews more important than ever.
- Personalization Pays Off: AI-powered personalization is a major trend. Tailoring the shopping experience can increase average order values and significantly boost revenue. In fact, 91% of consumers are more likely to shop with brands that provide personalized offers and recommendations.
- The Need for Speed: Fast delivery is no longer a perk; it’s an expectation. A significant number of shoppers want same-day shipping, and more than a quarter have abandoned a cart because same-day delivery wasn’t an option.
- Generational Shift: Gen Z and Millennials are the driving force in online retail, with their preferences for social commerce, mobile shopping, and authentic brand interactions shaping current trends.
Expert Insight: “The data is clear: if you’re not optimizing for mobile, you’re not just missing out on a segment of the market—you’re ignoring the majority. Every aspect of the user journey, from ad creative to the final checkout click, must be seamless on a smaller screen.”
Top eCommerce Websites Statistics

The engine behind every online store is its eCommerce platform. The competition in this space is fierce, with a few key players holding the largest eCommerce platform market share.
- Leading Platforms: WooCommerce remains a dominant force, powering a significant percentage of online stores globally. Shopify and BigCommerce continue to be popular choices for businesses of all sizes, known for their user-friendly interfaces and extensive app ecosystems.
- The Rise of Headless Commerce: Flexibility is the name of the game. Headless commerce, which decouples the front-end presentation layer from the back-end eCommerce functionality, is gaining serious traction. The market is projected to grow at a compound annual growth rate of over 20%. This approach allows brands to create highly customized and fast user experiences across any channel.
Conversion Rate Optimization (CRO) Stats
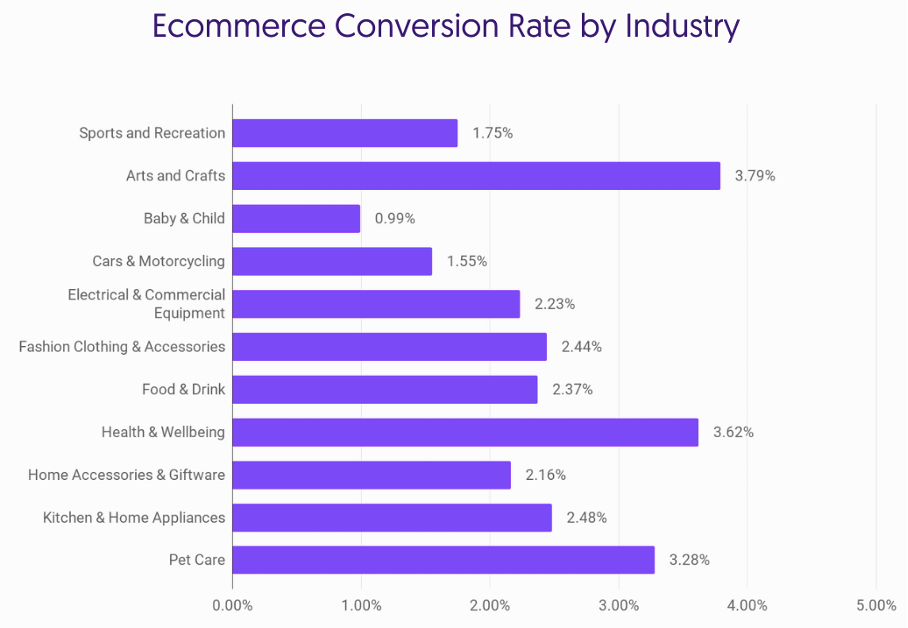
Getting visitors to your site is only half the battle. The real goal is converting them into paying customers. The average eCommerce conversion rate globally hovers between 2.5% and 3%. However, this can vary dramatically by industry.
- Industry Differences: Niches like Arts and Crafts often see higher conversion rates (3-7%), while industries with higher price points and longer consideration periods, like Baby & Child care, tend to have lower rates (1-2%).
- The Power of Video: Integrating product videos can have a massive impact, increasing the likelihood of a purchase by explaining features and building trust more effectively than static images alone.
- Speed Kills (Conversions): A slow-loading website is a conversion killer. Even a one-second delay can cause a significant drop in conversions as impatient shoppers quickly move on.
Cart Abandonment Statistics
One of the most persistent challenges in eCommerce is the abandoned cart. The average cart abandonment rate in 2025 is a staggering 70.19%. This means for every 10 shoppers who add an item to their cart, 7 leave without buying.
- Why Shoppers Leave: The top reasons are almost always preventable:
- Extra Costs are Too High (39%): Unexpected shipping, taxes, and fees are the #1 reason for abandonment.
- Slow Delivery (21%): Consumers want their items now, and long shipping times are a major deterrent.
- Forced Account Creation (19%): Requiring users to create an account before checkout adds friction and causes many to leave.
- Complicated Checkout (18%): A long or confusing process will frustrate users and lead to lost sales.
- Mobile Abandonment is Higher: The cart abandonment rate on mobile devices is even higher than on desktops, often exceeding 80%, highlighting the need for a simplified mobile checkout process.
Payment and Checkout Trends
A smooth and trustworthy payment process is critical. The final step in the customer journey must be as frictionless as possible.
- Digital Wallets Rule: Digital payment options like PayPal, Apple Pay, and Google Pay have become the standard, prized for their speed and security.
- Buy Now, Pay Later (BNPL) Surges: BNPL services are incredibly popular, especially with younger consumers. A survey found that 43% of Gen Z users will use BNPL. Offering these flexible payment options can reduce cart abandonment and increase conversion.
- One-Click Checkout: Inspired by giants like Amazon, one-click checkout is being adopted more widely to reduce friction and capture impulse buys.
Voice and Visual Commerce Stats
The ways consumers interact with eCommerce sites are expanding beyond the traditional keyboard and mouse.
- Voice Commerce: A growing number of consumers are using voice assistants like Alexa and Google Assistant for shopping, from adding items to a list to making full purchases.
- Visual Search: This technology allows shoppers to upload an image to find similar products. It’s a powerful discovery tool, especially in fashion and home decor, and can significantly increase engagement and conversion rates.
Social Commerce Statistics
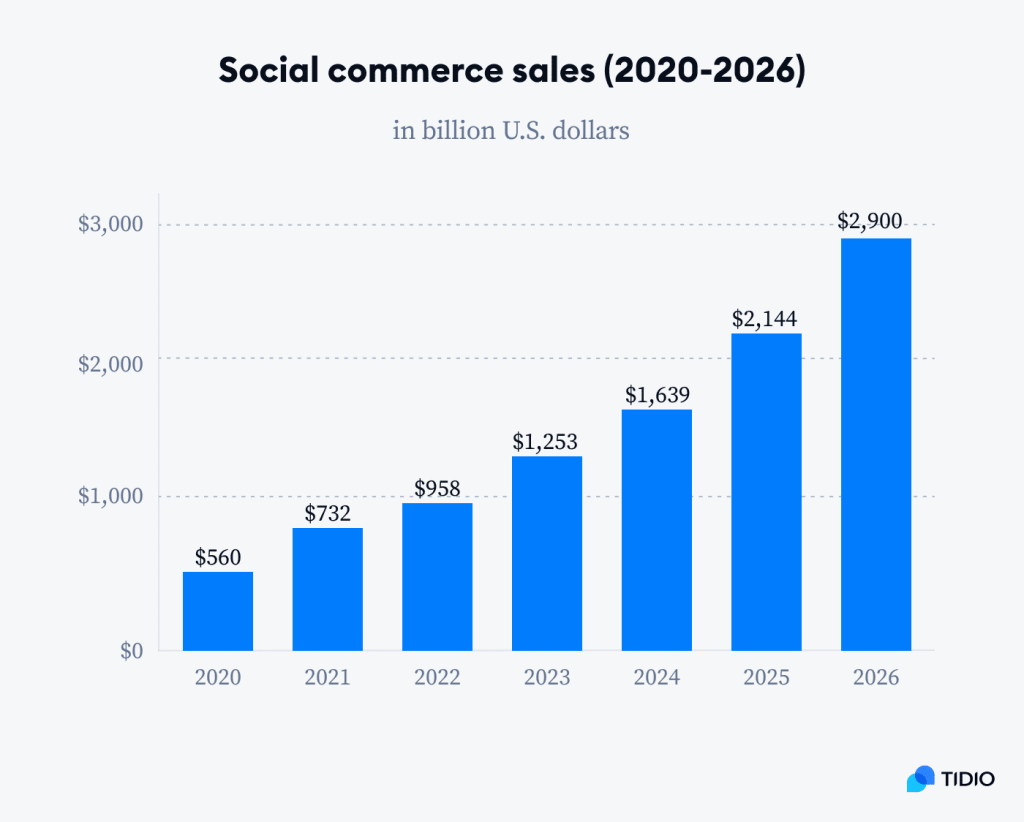
Social media is no longer just for brand awareness; it’s a rapidly growing sales channel. The social commerce market is projected to reach $1.6 trillion by 2024.
- Top Platforms: Instagram, TikTok, and Facebook are leading the way, integrating shopping features that allow users to buy products directly from posts and stories without leaving the app.
- Discovery-Driven: Around 40% of Gen Z consumers prefer to discover new products on social media platforms, making it a critical channel for reaching this demographic.
- Influencer Impact: Influencer marketing continues to be a powerful driver of sales, with recommendations from trusted creators leading to significant year-over-year growth in sales.
AI & Automation in eCommerce
Artificial Intelligence is revolutionizing every aspect of eCommerce, from marketing to logistics.
- Hyper-Personalization: AI in eCommerce analyzes customer data to deliver hyper-relevant product recommendations, which can boost sales by 15% or more.
- Efficient Customer Service: Chatbots now handle a vast majority of initial customer service inquiries, providing instant answers to common questions 24/7 and freeing up human agents to handle more complex issues. Businesses using AI chatbots have seen a 30% increase in customer satisfaction.
- Smarter Logistics: AI optimizes everything from inventory management to delivery routes, leading to fewer errors and faster fulfillment times.
Sustainability & Ethical Shopping Trends
Modern consumers are increasingly making purchasing decisions based on their values. Brands that prioritize sustainability and ethical practices are winning customer loyalty.
- Consumer Preference: A significant majority of consumers state they prefer to buy from brands that are committed to sustainable practices.
- Eco-Friendly Packaging: Brands that use recyclable or minimal packaging are viewed more favorably and can build stronger customer relationships.
- Transparency is Key: Shoppers value transparency in the supply chain. Knowing where and how products are made builds trust and can be a powerful differentiator.
B2B eCommerce Statistics
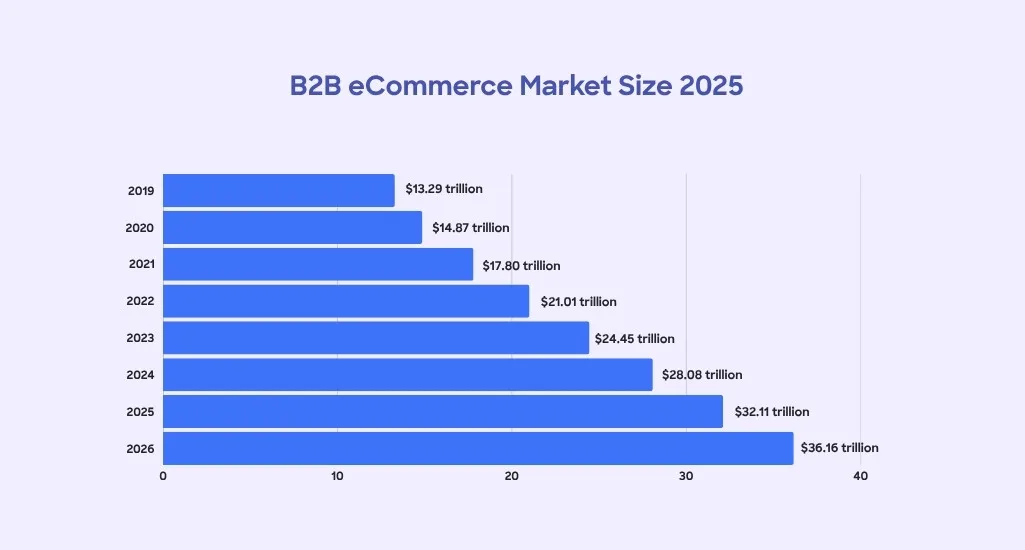
The business-to-business sector has also undergone a massive digital transformation. The B2B eCommerce market is enormous, with sales projections far exceeding the B2C market.
- Digital-First Approach: The vast majority of B2B buying decisions are now made online, with buyers preferring the convenience of self-service portals over traditional sales reps.
- Personalization Matters: Just like in B2C, B2B buyers expect a personalized experience with relevant product recommendations and pricing.
Shipping & Fulfillment Statistics
Logistics can make or break an eCommerce business. Customer expectations around shipping are higher than ever.
- The Power of “Free”: Free shipping is one of the most powerful motivators for online shoppers. Studies have consistently shown that offering it can increase conversion rates by 30% or more.
- Fast Delivery is Expected: Over 60% of online shoppers now expect fast delivery, typically defined as 1-2 days.
- The Importance of Returns: A clear and convenient returns policy is not just a courtesy; it’s a crucial factor in the purchase decision for over two-thirds of shoppers.
Cybersecurity & Trust in eCommerce
With the growth of online shopping comes the increased risk of fraud. Building and maintaining trust is paramount.
- Rising Fraud: Global eCommerce fraud losses are a multi-billion dollar problem, making robust security measures essential.
- Building Confidence: Simple visual cues like SSL encryption certificates and trust badges on checkout pages can significantly improve conversion by reassuring customers that their data is safe.
- Two-Factor Authentication (2FA): Adoption of 2FA is growing rapidly as both businesses and consumers seek stronger security to protect accounts and payment information.
Top Emerging eCommerce Markets in 2025
While established markets like the US and China are huge, the most exciting growth is happening in emerging economies.
- Fastest-Growing Regions: Markets in Southeast Asia, India, and Brazil are expanding at a phenomenal rate.
- Drivers of Growth: This growth is fueled by increasing internet penetration, a mobile-first consumer base, and a rising middle class with more disposable income.
Future Outlook of eCommerce (2025–2030)
Looking ahead, the line between the physical and digital worlds will continue to blur. Expect to see:
- Immersive Experiences: The use of Augmented Reality (AR) and Virtual Reality (VR) will become more common, allowing shoppers to “try on” clothes or visualize furniture in their homes.
- Total Automation: AI will move beyond recommendations to fully automate order management, customer support, and even content creation for product pages.
- Hyper-Personalization at Scale: eCommerce will move toward a “segment-of-one” model, where every customer’s experience is completely unique and tailored to their real-time behavior and preferences.
Final Thoughts: What This Means for Your Business
The message from the 2025 eCommerce statistics is loud and clear: the digital marketplace is dynamic, competitive, and full of opportunity. The brands that will win are those that adapt quickly, place the customer at the center of their strategy, and embrace new technologies. From optimizing for mobile and personalizing the shopping experience to ensuring fast shipping and secure checkout, meeting and exceeding customer expectations is the formula for success.
At Silver WebBuzz, a seasoned eCommerce web Development Company, we help businesses launch powerful, scalable, and high-converting eCommerce websites tailored to their unique goals.